Reports from the Looko2 Extender
7 September 2020 | News
Below you will find information on how to download reports from the looko2 extender. This applies to the Extender version for temperature, humidity, atmospheric pressure measurements, but also for CO2 measurements.
- Please prepare an ID Extender. It is a unique number by which we will identify the device.
You received it together with the operating instructions, the warranty for the device or in an individual e-mail from the seller. - Reports from sensors (CO2, temperature, humidity, air pressure) can be found at the following link:
3. After opening the above link, please find the ID of your device in the name of the file along with the date for which the system stores data. For example, for a sensor that measures temperature, humidity and air pressure – 2CF4325DDEF9:
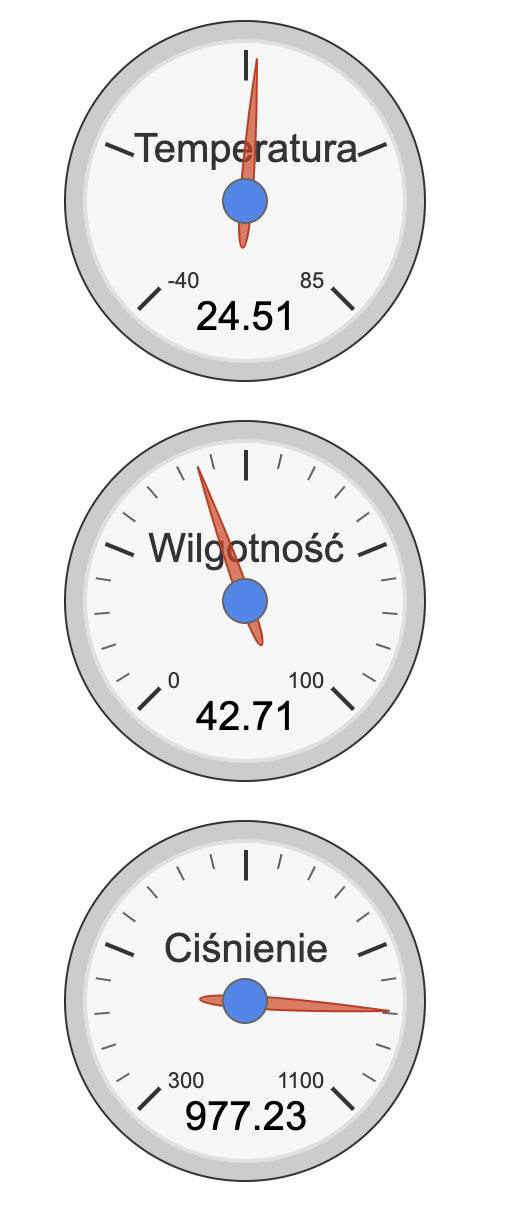
4. After opening the file for the Extender measuring temperature, pressure and air humidity, you will see the following data:
1574273166,2019-11-20 19:06,34.27,990.90,1016.68,214,23.72,7.06,-26,1
The first column (separated by commas) is the time in EPOCH format
The second is the date and time of the measurement
The third is humidity
The fourth is pressure
The fifth is the pressure above sea level
Fifth (214) – we ignore
Sixth – temperature
The rest – we ignore them
5. For the sensor measuring the CO2 level with the ID number 2CF4324A8CB5 – an example link is:
6. After opening the file for the Extender measuring the CO2 level, you will see the following data:
1575242144,2019-12-02 00:15,449.00,-18
The first column (separated by commas) is the time in EPOCH format
The second is the date and time of the measurement
The third is CO2 measurement
We ignore the fourth one
7.
To visualize reports on a chart in a spreadsheet (eg Microsoft Excel), save the file and import it into the program, selecting a comma as a symbol separating individual cells during import. The next columns should be named and from then on you can freely create charts.
To visualize reports on a chart in a spreadsheet (eg Microsoft Excel), save the file and import it into the program, selecting a comma as a symbol separating individual cells during import. The next columns should be named and from then on you can freely create charts.
